Notes
A linear equation has slope-intercept form y = ax + b, where y is the output variable, x is the input variable, and a and b are constants. Thinking of the equation as a straight line on a graph with horizontal axis x and vertical axis y, a is the slope (change in y per unit change in x) and b is the y-intercept (value of y when x = 0). The equation can also be written in point-slope form (y – y0) = a(x – x0), where (x0, y0) is any particular point on the line.
Examples of linear equations in financial applications are cost, revenue, and profit functions. Suppose a machine has a fixed cost of $50 per day and the total cost to produce 10 widgets is $250.
- The marginal cost per widget is ($250 – $50) / 10 = 200 / 10 = $20 per widget.
- The cost function per day is c = 20x + 50, where x is the number of widgets. For example, if x = 10, then c = 20(10) + 50 = 200 + 50 = $250. Or, if x = 30, then c = 20(30) + 50 = 600 + 50 = $650.
- If the widgets sell for $22 each, then the revenue function is r = 22x. For example, if x = 10, then r = 22(10) = $220. Or, if x = 30, then r = 22(30) = $660.
- The profit function is revenue – cost, so p = r – c = 22x – (20x + 50) = 2x – 50. For example, if x = 10, then p = 2(10) – 50 = –$30. Or, if x = 30, then p = 2(30) – 50 = $10.
We can draw these functions on graphs:
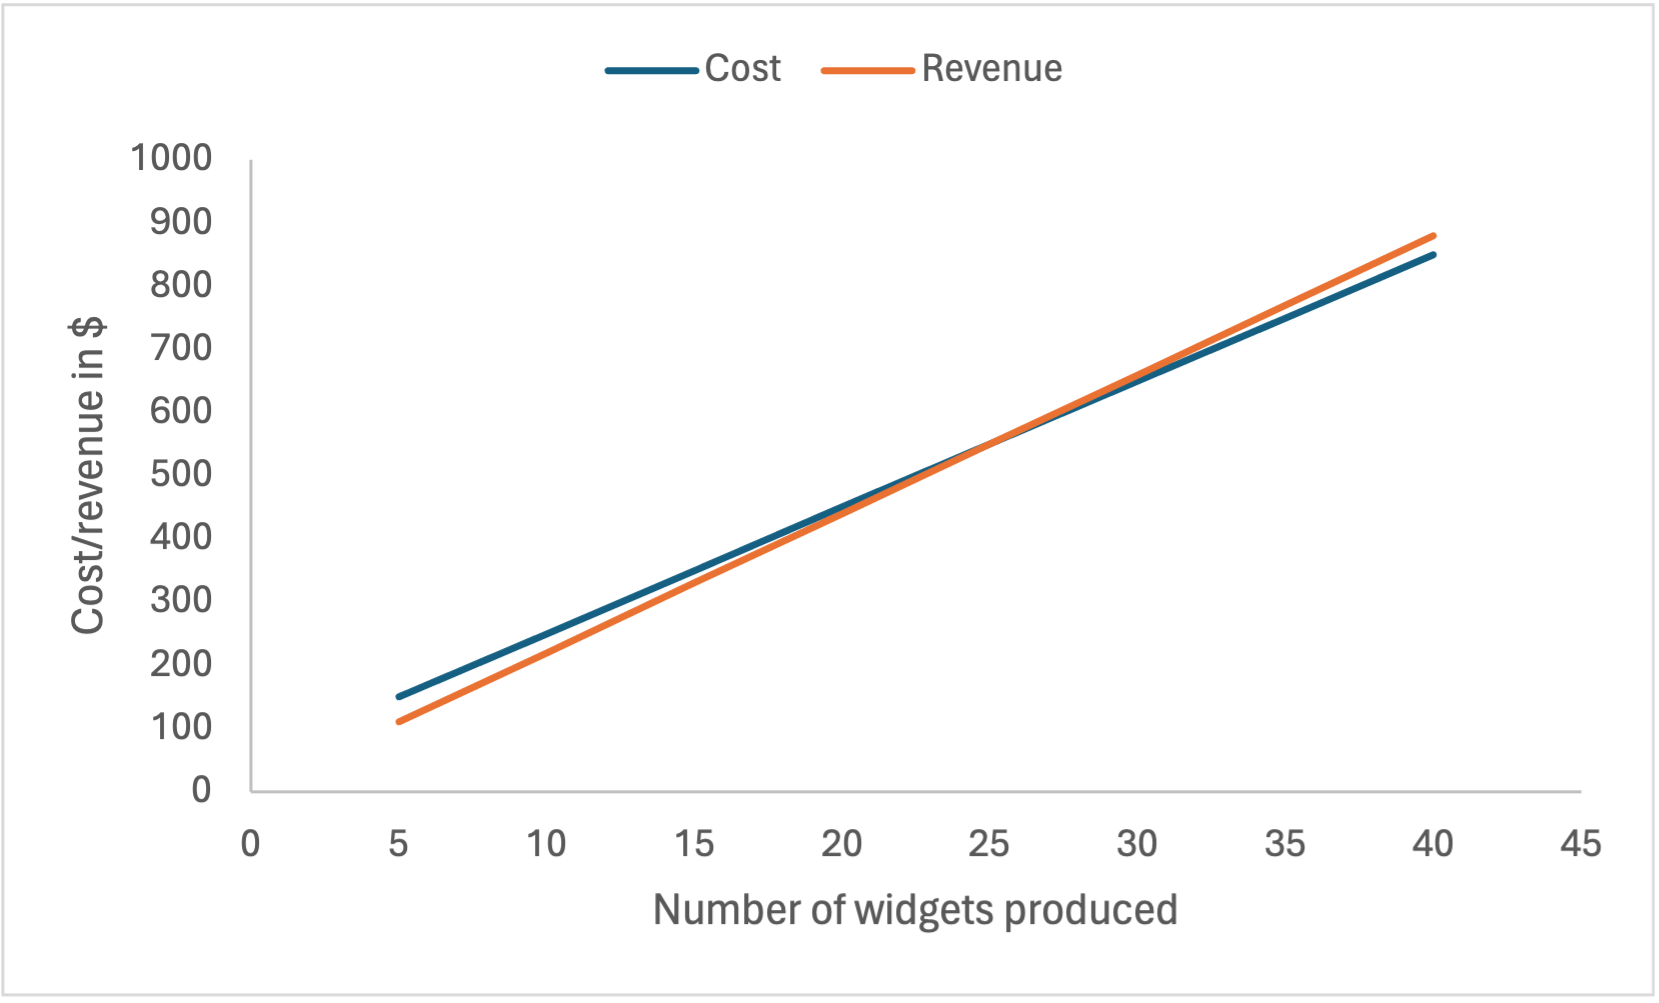
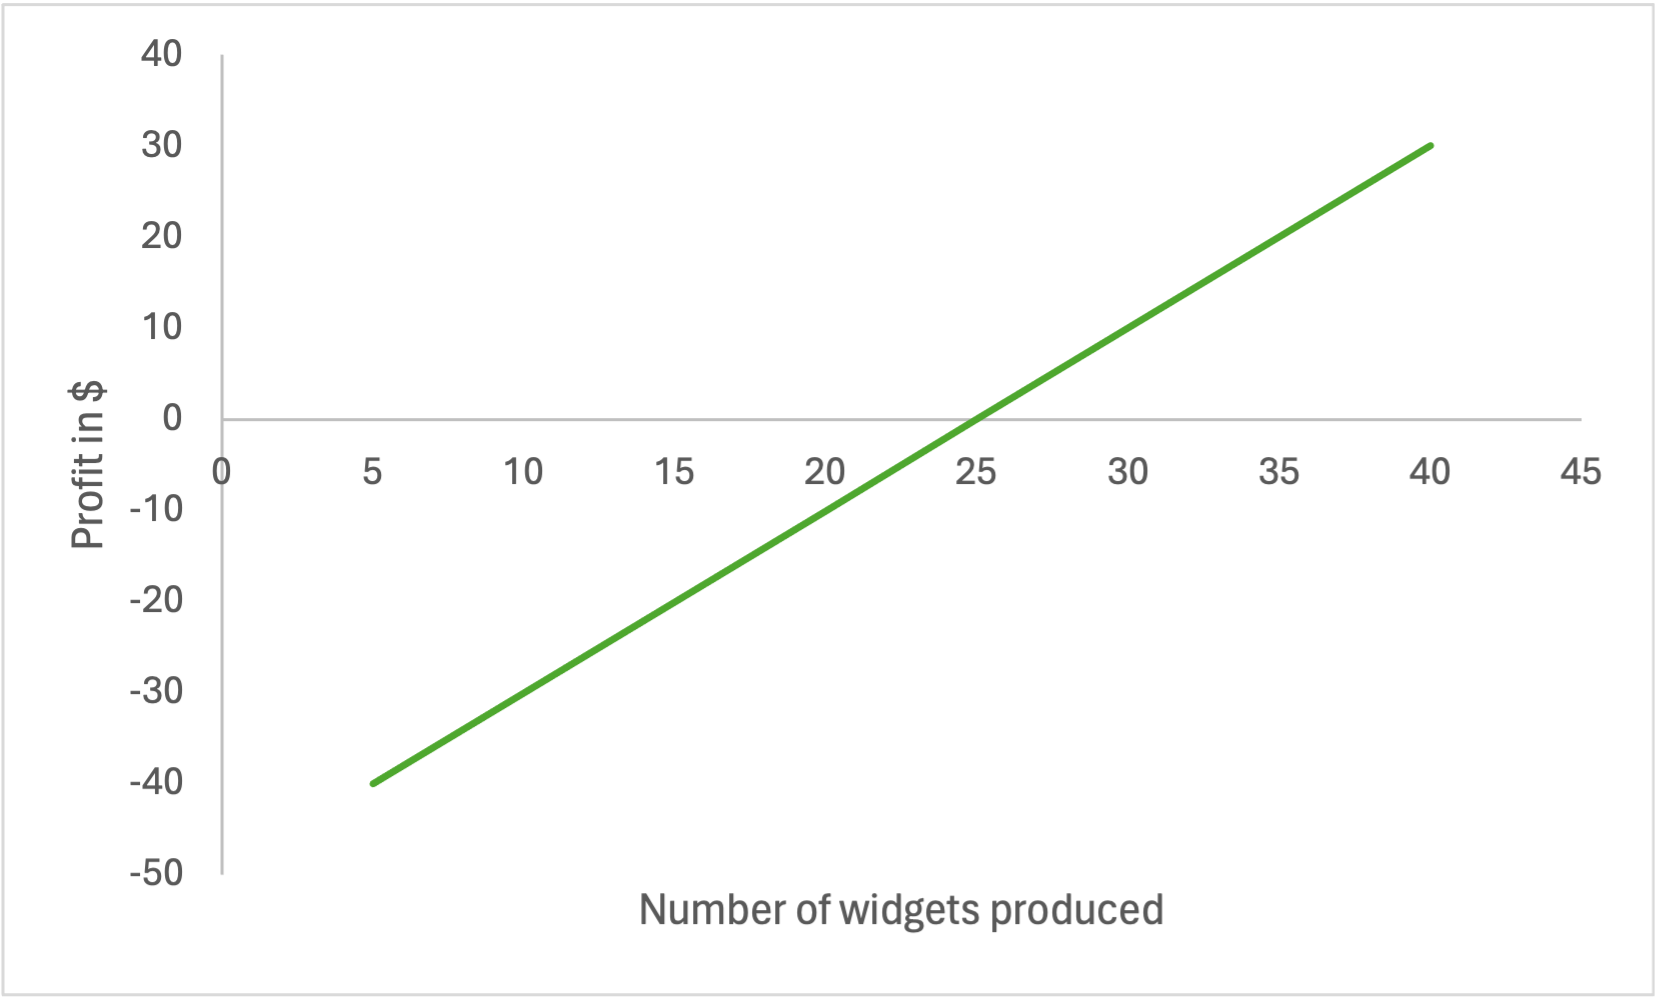
We can use the profit function to answer questions like the following:
- How many widgets must be produced by the machine to break even? This occurs when profit = 0, so set 2x – 50 = 0 and solve for x: x = 50 / 2 = 25. We can see this in the graph above where the profit function crosses the horizontal axis.
- How many widgets must be produced to create a profit of $20? This occurs when profit = 20, so set 2x – 50 = 20 and solve for x: x = (20+50) / 2 = 70 / 2 = 35.
Video Tips
Practice Exercises
